Start with clean, consistent data
Use one row per period-usually a month-and one column per measure, such as leads, sessions, orders or revenue. Keep the period label in its own column (for example 2026-09) so the report can use it for comparisons and charts.
Lead with the numbers that matter
Choose two or three measures the client actually cares about and show their totals first. More metrics do not make a better report; they make the important ones harder to find.
Show change, not just totals
A total without context is hard to judge. Show the latest period against the previous one, and highlight the best and worst periods. "Revenue up 41% on August" tells a story that "Revenue: 22,800" does not.
Add short commentary
Two or three sentences explaining why the numbers moved and what you will do next turn data into a service. Keep it factual and specific to this period.
Keep the format repeatable
Use the same structure every month: headline numbers, change versus last period, a simple chart and commentary. Clients learn where to look, and you spend minutes rather than hours preparing it.
Generate the report automatically
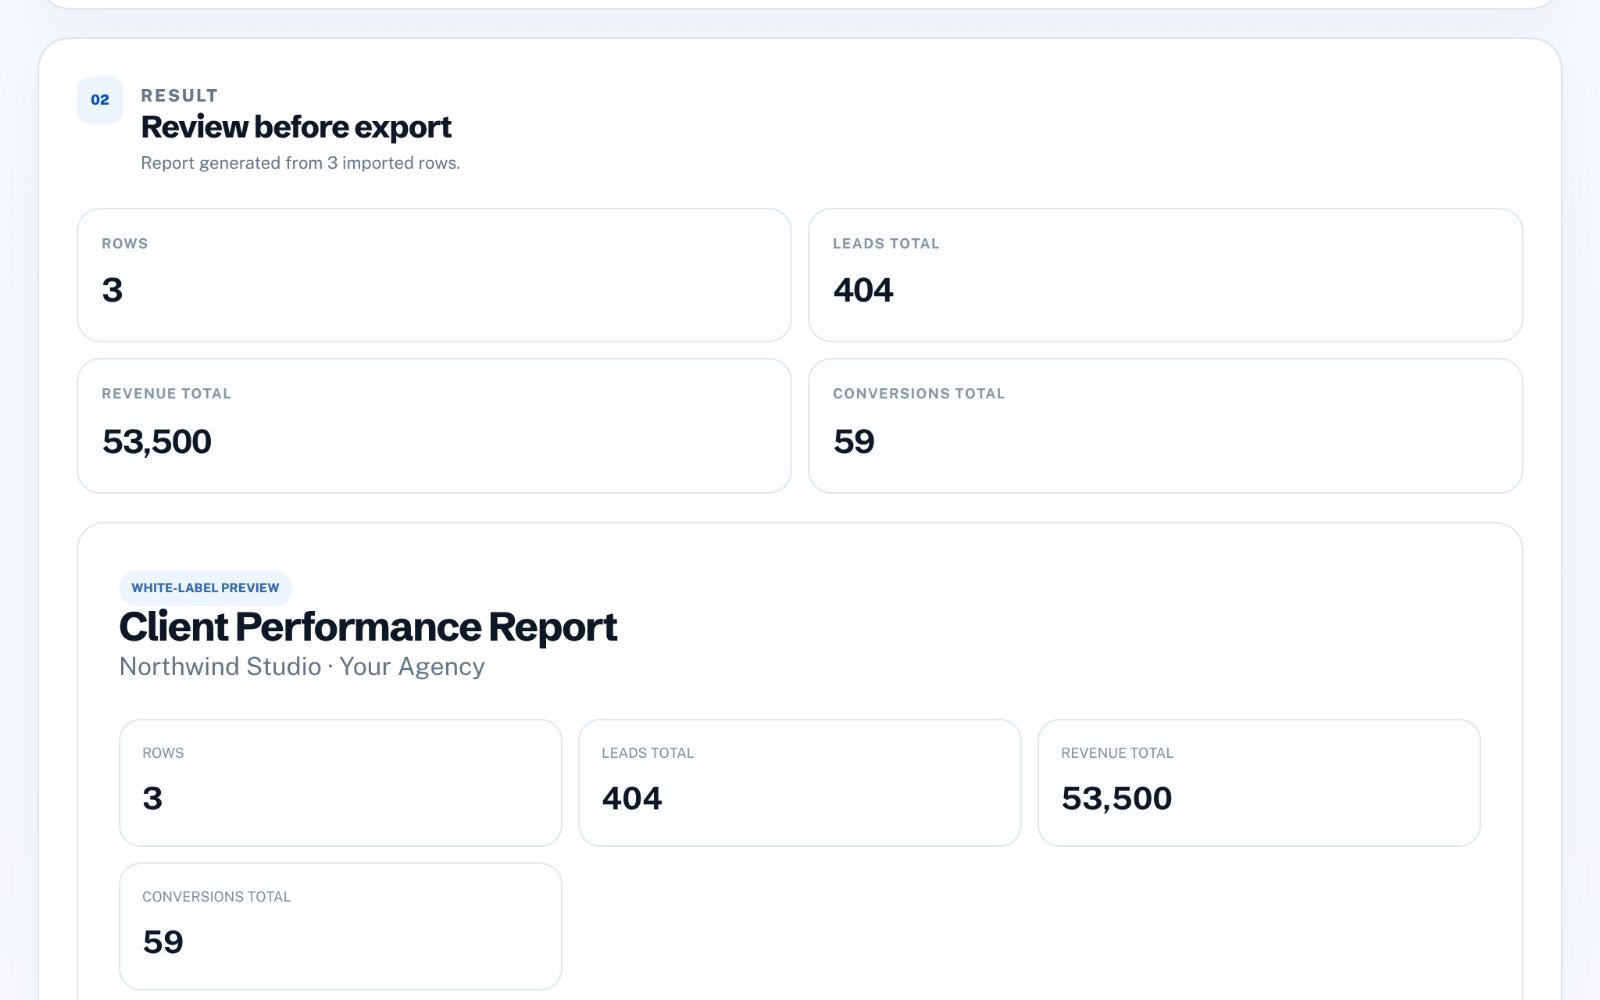
zastech Client Report Builder reads a CSV or Excel file and produces totals, averages, highest and lowest periods, latest change and an automatic summary, with a bar chart and summary table. You can add your own title, client name and commentary, then export an HTML report. It is free forever with a small zastech footer; a one-time license makes reports fully white-label.